
Advertisement
Advertisement
Natural Gas and Oil Forecast: WTI Nears $63, Gas Faces $3.75 Hurdle as Market Volatility Builds
By:
Key Points:
- WTI crude nears $63 per barrel, driven by geopolitical tensions and OPEC+ output strategy.
- Natural gas futures stall below $3.75 resistance as technical patterns point to downside risk.
- A weaker US dollar boosts demand for dollar-denominated commodities like oil and natural gas.

Market Overview
WTI crude oil futures rose to $63.00 per barrel, extending a two-day rally fueled by geopolitical tensions that continue to rattle energy markets. The protracted conflict and recent escalations have stoked concerns over supply disruption, especially as OPEC+ maintained its planned production increases for July, easing worries of a glut.
Simultaneously, a weakening US dollar, pressured by global trade frictions, has increased the appeal of dollar-priced commodities, such as crude oil.
This combination of factors—limited supply expansion, currency shifts, and geopolitical uncertainty—has contributed to sustained volatility in oil and natural gas prices, reflecting a complex interplay of market forces.
Natural Gas Price Forecast

Natural Gas Futures (NGN2025) are consolidating below the $3.75 resistance, where a descending trendline converges with horizontal levels. The price faces downward pressure, with the 50-period EMA at $3.64 and the 200-period EMA around $3.64 offering nearby support.
The price action shows a sharp rejection from $3.75, hinting at potential downside momentum.
If selling pressure continues, a breakdown below $3.66 could open the door for a move toward $3.58 or even $3.44. However, if the price manages to break decisively above $3.75, there is room to target higher resistance around $3.83.
WTI Oil Price Forecast
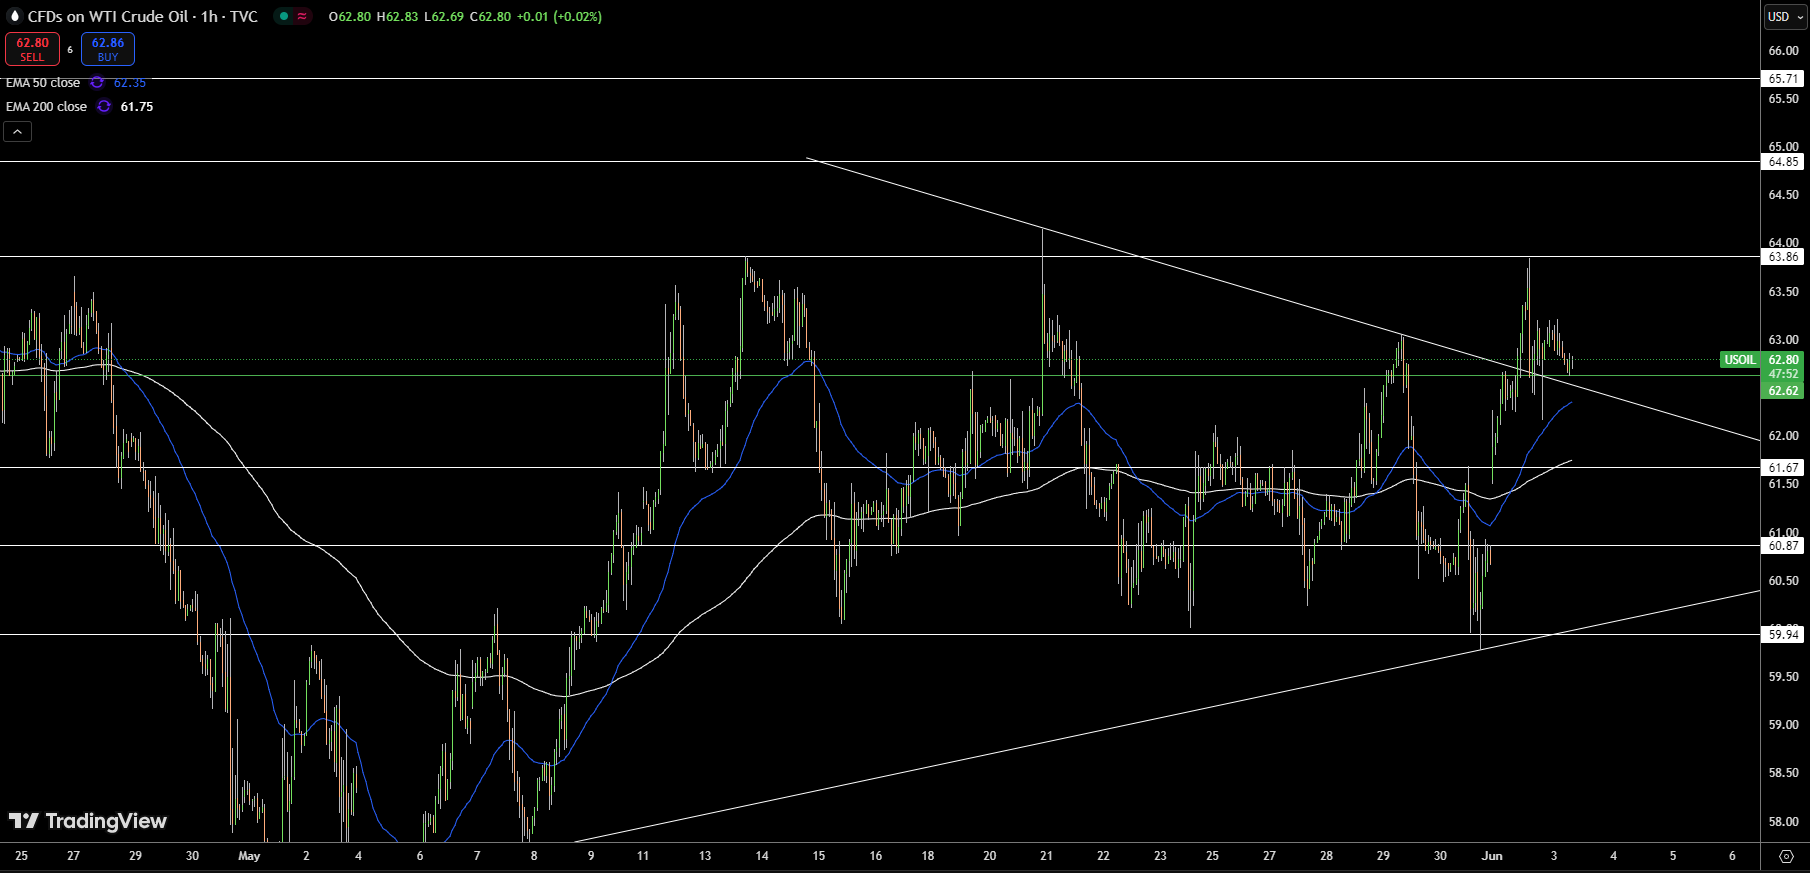
WTI crude oil is consolidating just below the $63.00 resistance, where a descending trendline converges with horizontal resistance levels. The 50-period EMA near $62.95 and the 200-period EMA around $61.75 provide immediate dynamic support.
Price action remains constrained within a tightening range, hinting at an impending breakout or breakdown. A confirmed close above $63.00 could trigger a move toward $64.85, while failure to hold this level may see a retreat toward $61.67 or even $60.87.
Brent Oil Price Forecast

Brent Crude Oil is consolidating below the $65.82 resistance, marked by a descending trendline that intersects horizontal resistance levels. The price is supported by the 50-period EMA at around $64.39 and the 200-period EMA near $64.27, both of which offer dynamic support.
If UKOIL can sustain a breakout above $65.82, it could target higher resistance levels around $66.52 and $67.22. However, failure to clear this barrier could result in a pullback toward $64.03 or even $63.34. The overall pattern suggests tightening price action within a larger wedge, hinting at a potential decisive move.
About the Author
Arslan Aliauthor
Arslan is a finance MBA and also holds an MPhil degree in behavioral finance. An expert in financial analysis and investor psychology, Arslan uses his academic background to bring valuable insights about market sentiment and whether instruments are likely to be overbought or oversold.


Advertisement